Loading
West Virginia at Texas Tech
- Kickoff
- Sat Nov 7, 9:30 PM ET
- Network
- ESPN
- Venue
- Galaxy Stadium, Lubbock, TX
- Verdict
- Must watch
After the game
Highlights
5-3WVUWest Virginia Mountaineers
#15 · 7-1TTUTexas Tech Red Raiders
Source: ESPN College Football
Thomas Castellanos throws 5 TD passes as No. 13 Texas Tech holds off West Virginia 53-48
Read the ESPN recap (opens in a new tab)Takeaways
Written by AI from the game data
- No. 15 Texas Tech beat West Virginia 53-48 at home in Lubbock, a game with 101 combined points.
- Texas Tech led 41-27 at halftime, West Virginia scored 21 unanswered in the third to lead 48-41, and Texas Tech won the fourth 12-0.
- The teams combined for 1,220 yards, 638 for Texas Tech and 582 for West Virginia, with no turnovers.
- Thomas Castellanos threw for 362 yards and 5 touchdowns; West Virginia's TaRon Francis had 169 yards on 3 catches, and J'Koby Williams ran for 160.
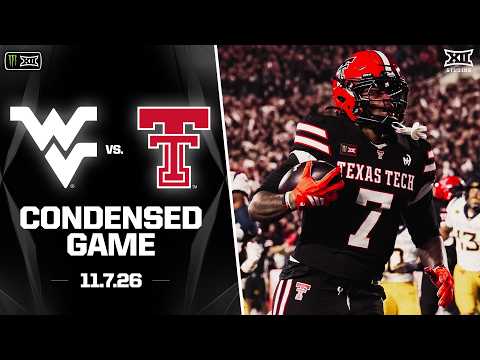
West Virginia vs. #15 Texas Tech Condensed Game | 2026 Monster Energy Big 12 Football
Condensed · Big 12 Conference
During the game
Key events17
- 1st 9:26WVUAmari Latimer 3 Yd Run (Jack Cassidy Kick)
- 1st 13:02TTUTerrance Carter Jr. 30 Yd pass from Thomas Castellanos (Stone Harrington Kick)
- 1st 4:39WVUJack Cassidy 30 Yd Field Goal
- 1st 4:26TTUJ'Koby Williams 75 Yd Run (Stone Harrington Kick)
- 1st 0:58WVUMichael Hawkins Jr. 3 Yd Run (Jack Cassidy Kick)
- 2nd 13:37TTUTerrance Carter Jr. 29 Yd pass from Thomas Castellanos (Stone Harrington Kick)
- 2nd 13:06WVUTaRon Francis 73 Yd pass from Michael Hawkins Jr. (Jack Cassidy Kick)
- 2nd 9:28TTUJett Carpenter 1 Yd pass from Thomas Castellanos (Stone Harrington Kick)
- 2nd 7:31TTUKenny Johnson 38 Yd pass from Thomas Castellanos (Stone Harrington Kick)
- 2nd 2:19WVUJack Cassidy 29 Yd Field Goal
- 2nd 1:13TTUQuinten Joyner 1 Yd Run (Matt Ludwig Run for Two-Point Conversion)
- 3rd 11:15WVUMichael Hawkins Jr. 2 Yd Run (Jack Cassidy Kick)
- 3rd 3:50WVUCam Cook 2 Yd Run (Jack Cassidy Kick)
- 3rd 1:12WVUMichael Hawkins Jr. 3 Yd Run (Jack Cassidy Kick)
- 4th 7:55TTUStone Harrington 46 Yd Field Goal
- 4th 2:44TTUKenny Johnson 5 Yd pass from Thomas Castellanos (Stone Harrington Kick)
- 4th 1:24TTUTrey White Safety
Win probability
Chance each team wins, by game time (ET). Top: TTU, bottom: WVU.
Before the game
Win chance
West Virginia Mountaineers 15% · Texas Tech Red Raiders 85%
From pre-game prices