Loading
Oklahoma City at Portland
- Kickoff
- Wed Nov 11, 10:00 PM ET
- Network
- KUNP 16, BlazerVision, KSBI, Thunder App
- Venue
- Moda Center, Portland, OR
- Verdict
- Must watch
After the game
Highlights
Condensed game
OKCOklahoma City Thunder
PORPortland Trail Blazers
Source: NBA
Trail Blazers sweep the Thunder with a 118-108 win
Read the ESPN recap (opens in a new tab)Takeaways
Written by AI from the game data
Takeaways aren't generated yet.
Stats
OKC 108 · POR 118Final
| Team | 1 | 2 | 3 | 4 | T |
|---|---|---|---|---|---|
| OKC |
THUNDER at TRAIL BLAZERS | FULL GAME HIGHLIGHTS | November 11, 2026
Highlights · NBA

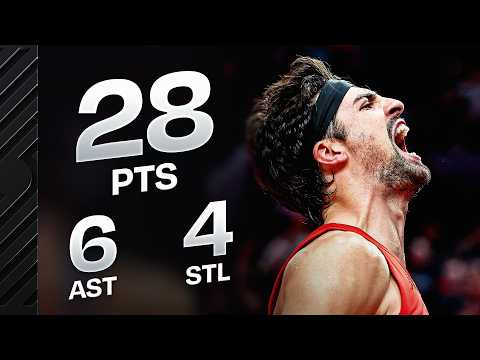
Deni Avdija’s 28-Point Takeover Lifts The Trail Blazers vs. The Thunder 🚨 | November 11, 2026
Video · NBA
Final 4:56 ELECTRIC ENDING Thunder at Trail Blazers | November 11, 2026
Video · NBA

During the game
Win probability
Chance each team wins, by game time (ET). Top: POR, bottom: OKC.
Before the game
Win chance
Oklahoma City Thunder 43% · Portland Trail Blazers 57%
From pre-game prices
Injuries
OKC
- Jaylin Williams FOutBack
- Thomas Sorber COutKnee
- Cason Wallace GOutShoulder
- Chet Holmgren COutKnee
POR
- Vit Krejci GOutAnkle
- Ja Morant GOutHamstring
- Shaedon Sharpe GOutKnee